Reading results and statistics
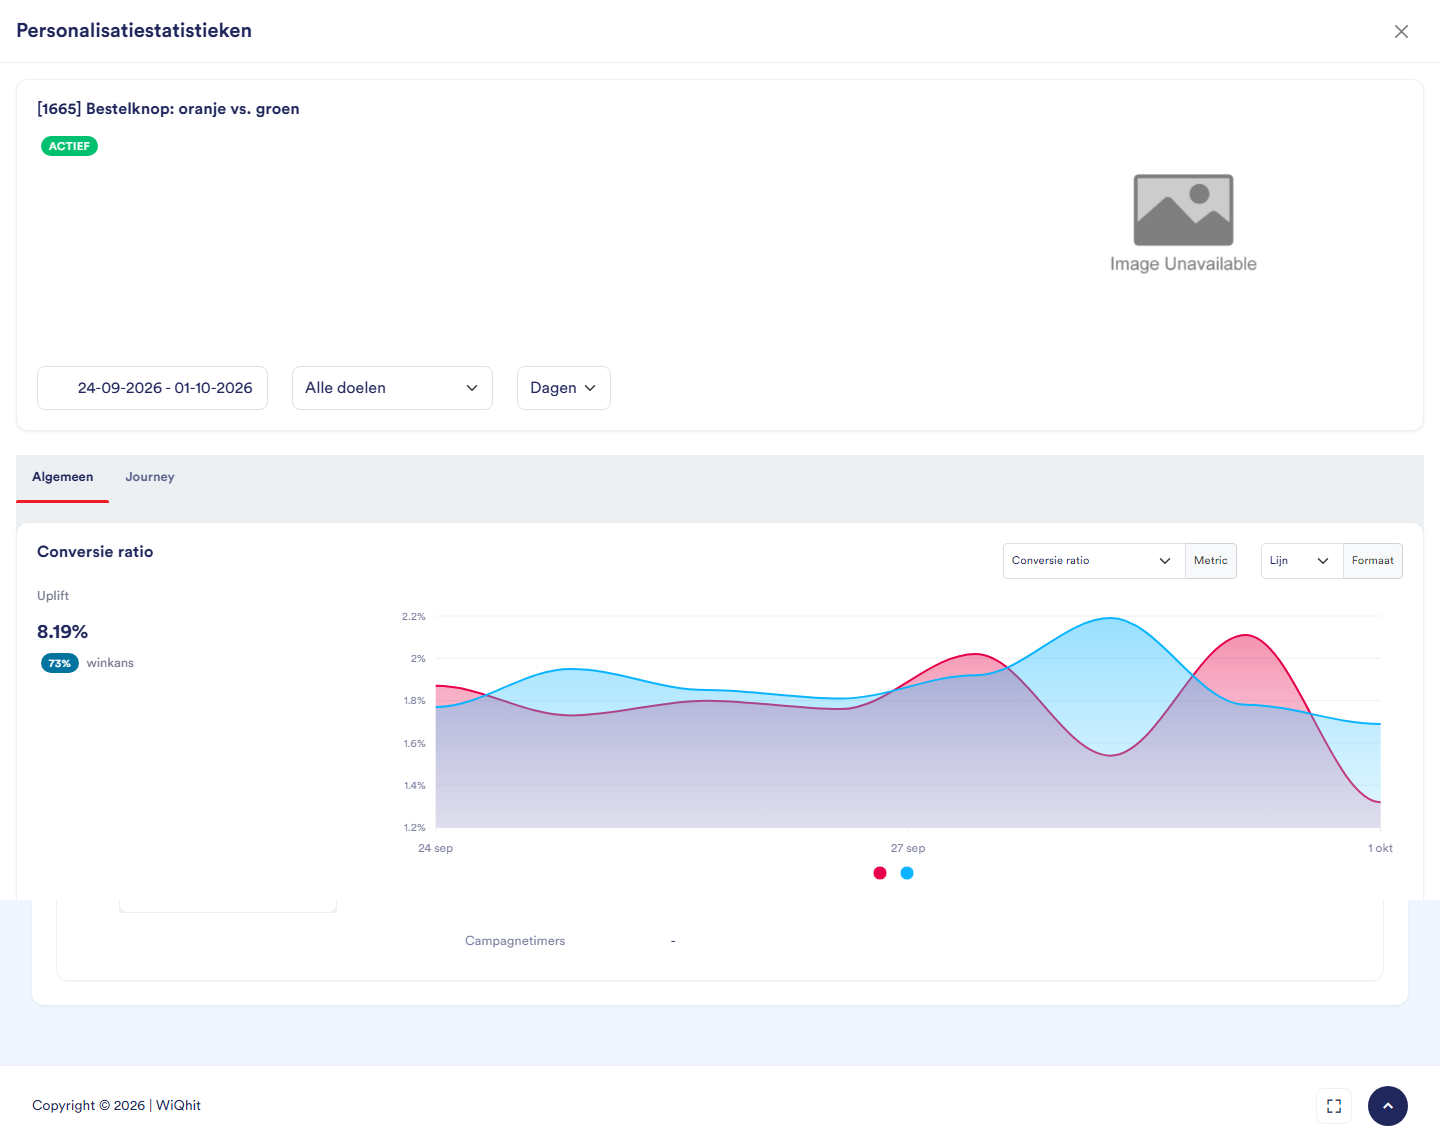
Note: The window is called Personalisation statistics, also for an A/B test.
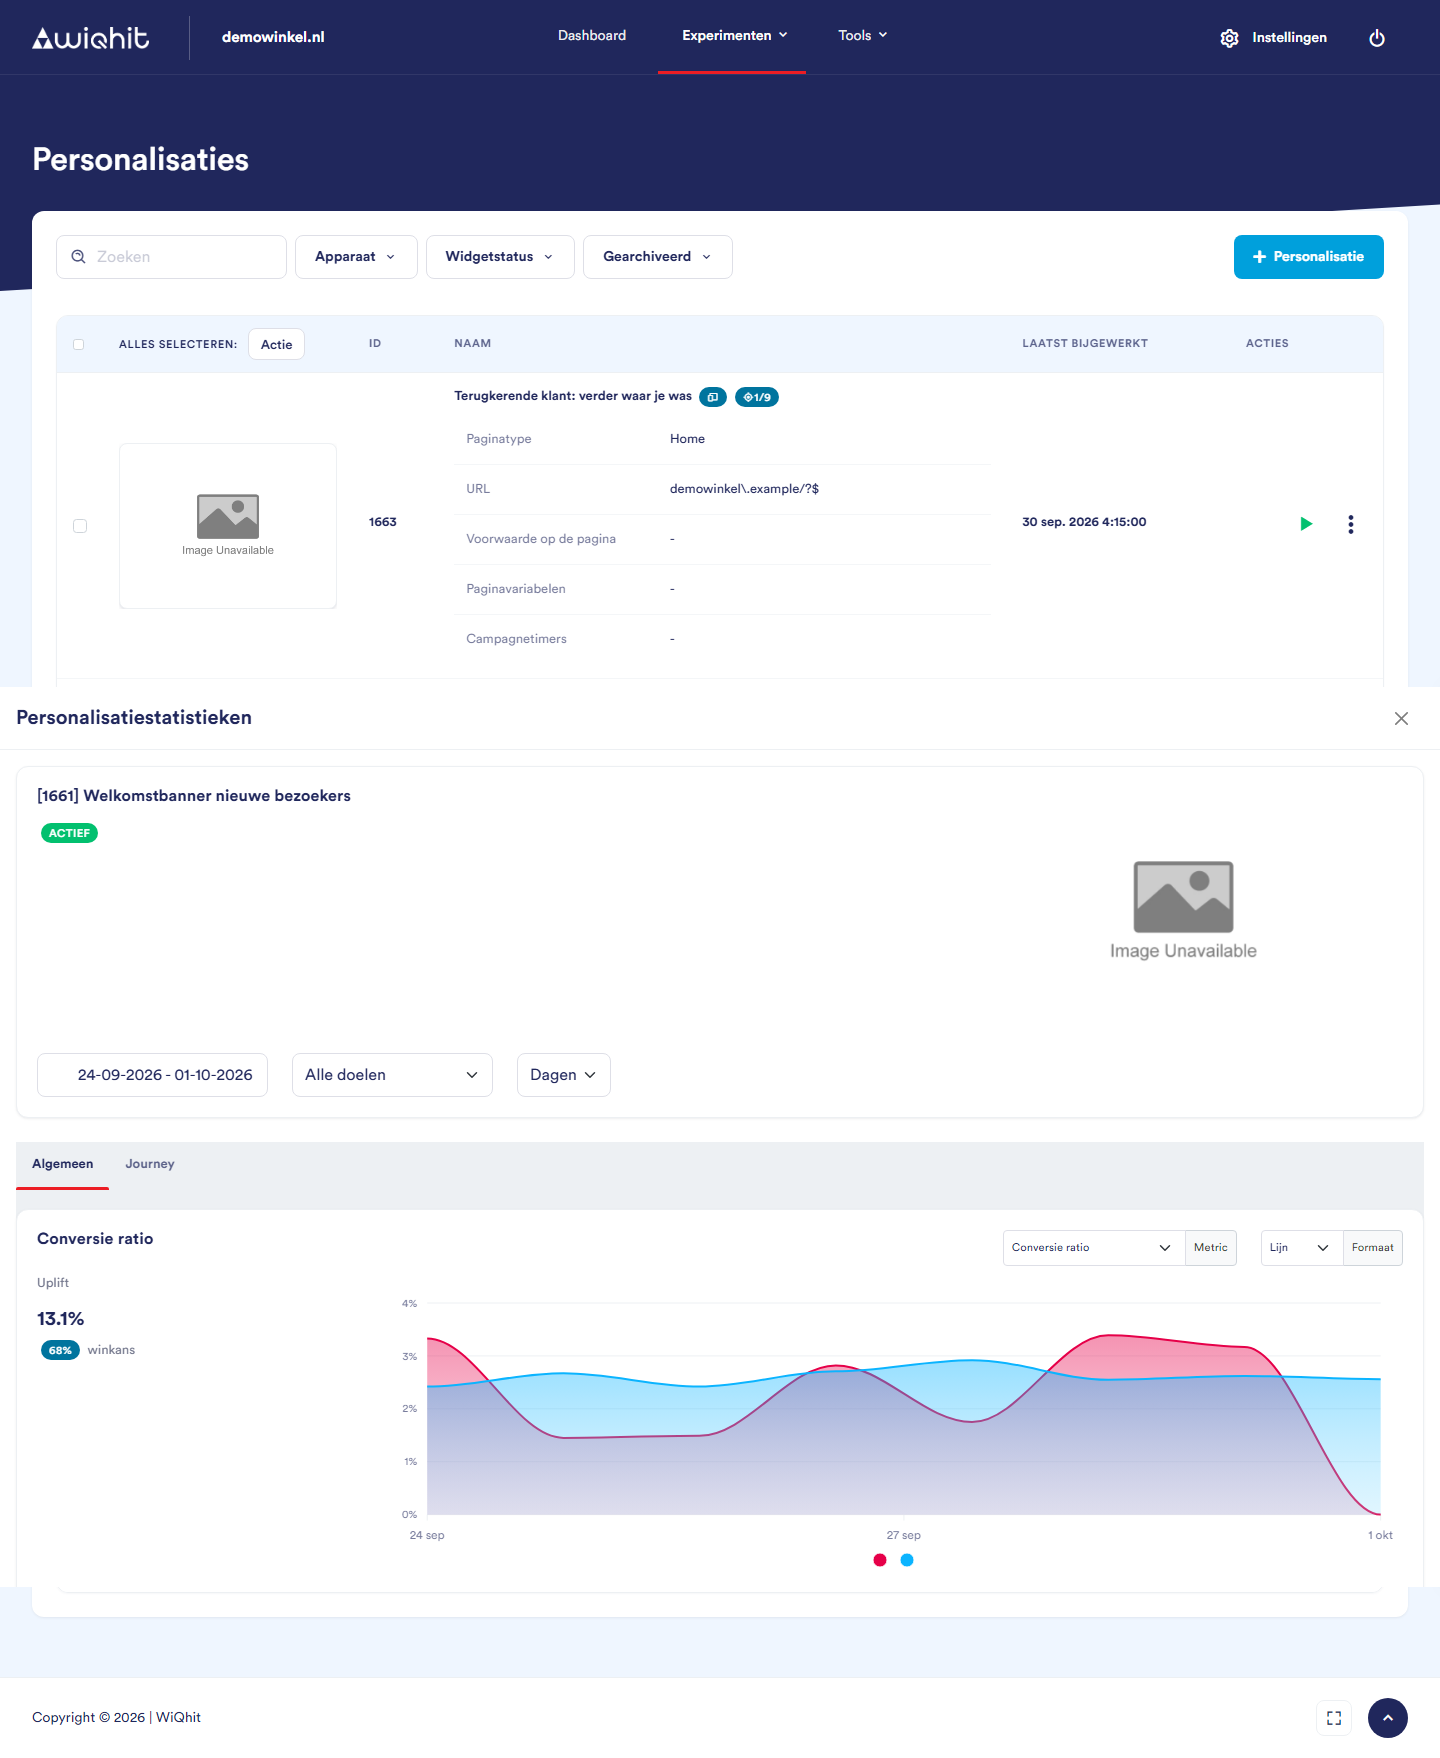
Choosing the period and the goal
Period: by default the last 7 days, or the period you previously chose in the same browser tab.
Goal: choose the goal that matters, such as an order, instead of All goals. The Average order value will then also be more accurate: with All goals, WiQhit divides the revenue by all conversions combined.
Days, Weeks or Months: how the chart groups the figures.
Note: The figures are updated every hour with the previous full hour. New results will therefore only show up after one to two hours.
Uplift and win probability
Uplift: how many percent higher (or lower) the variants together score than the control group.
win probability: the probability that the personalisation, or for an A/B test Variant 1, is better than the control group. From 95% it turns green, at 5% or less red.
Important: The notification Possible SRM detected! for an A/B test means that the distribution of visitors across the groups deviates strongly from what you set up. Do not simply trust the outcome in that case. First check whether the distribution changed along the way, for example because you saved the test again in the editor.
The table per variant
CR: the conversion rate, with the number of conversions and the number of visits in brackets.
Impr.: how many percent better or worse the variant scores than the control group.
Win probability %: the probability that this variant is better than the control group.
BR: the bounce rate, the share of visits that left again after one page.
Viewed conversion rate: the share of the times the widget was prepared that it was actually shown.
Important: The win probability in the widget lists is calculated differently from the one in this table. Always use the table in this window to draw a conclusion.
Journey
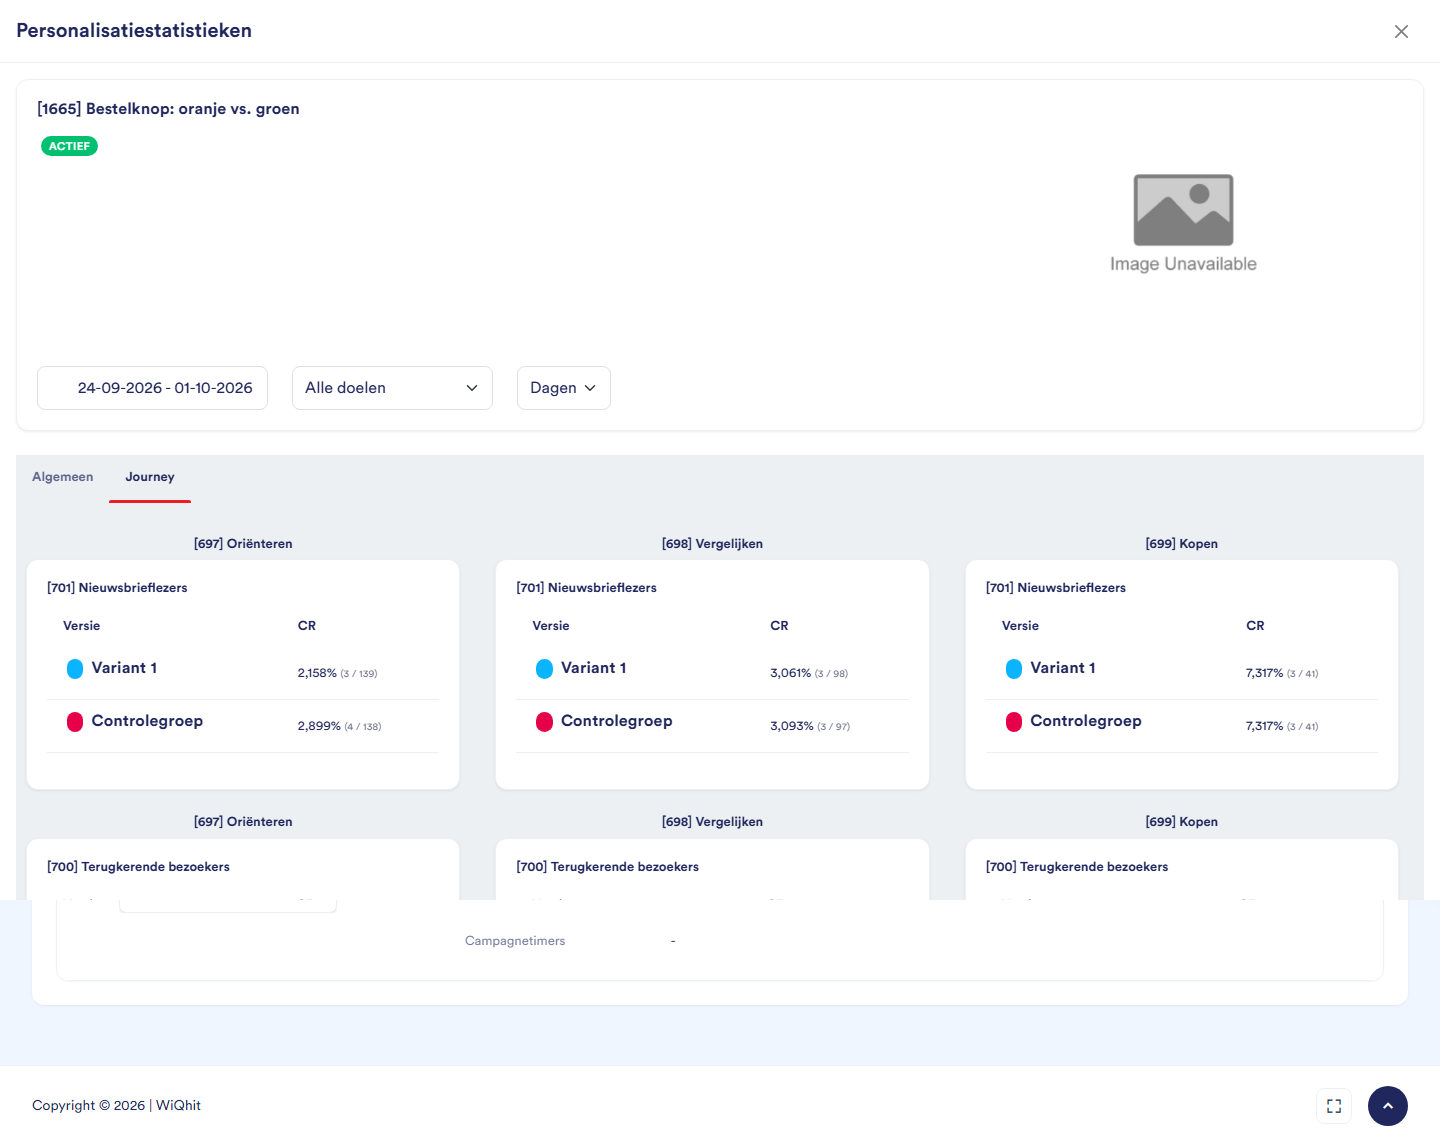
Note: The numbers per cell are small. A difference here is therefore less likely to mean something.
Considerations: when do you draw a conclusion?
Wait for enough conversions. With a handful of conversions per group, the result can still go either way.
Measure full weeks. Visitors behave differently at the weekend than during the week. Let a test run for at least one, preferably two full weeks.
Do not stop at the first good result. The win probability fluctuates strongly in the first few days. If you stop as soon as it turns green, you often pick a winner that is not one.
A winner has a win probability of 95% or more (the green tick). Between 5% and 95%, the outcome is still uncertain.