Getting started with WiQhit
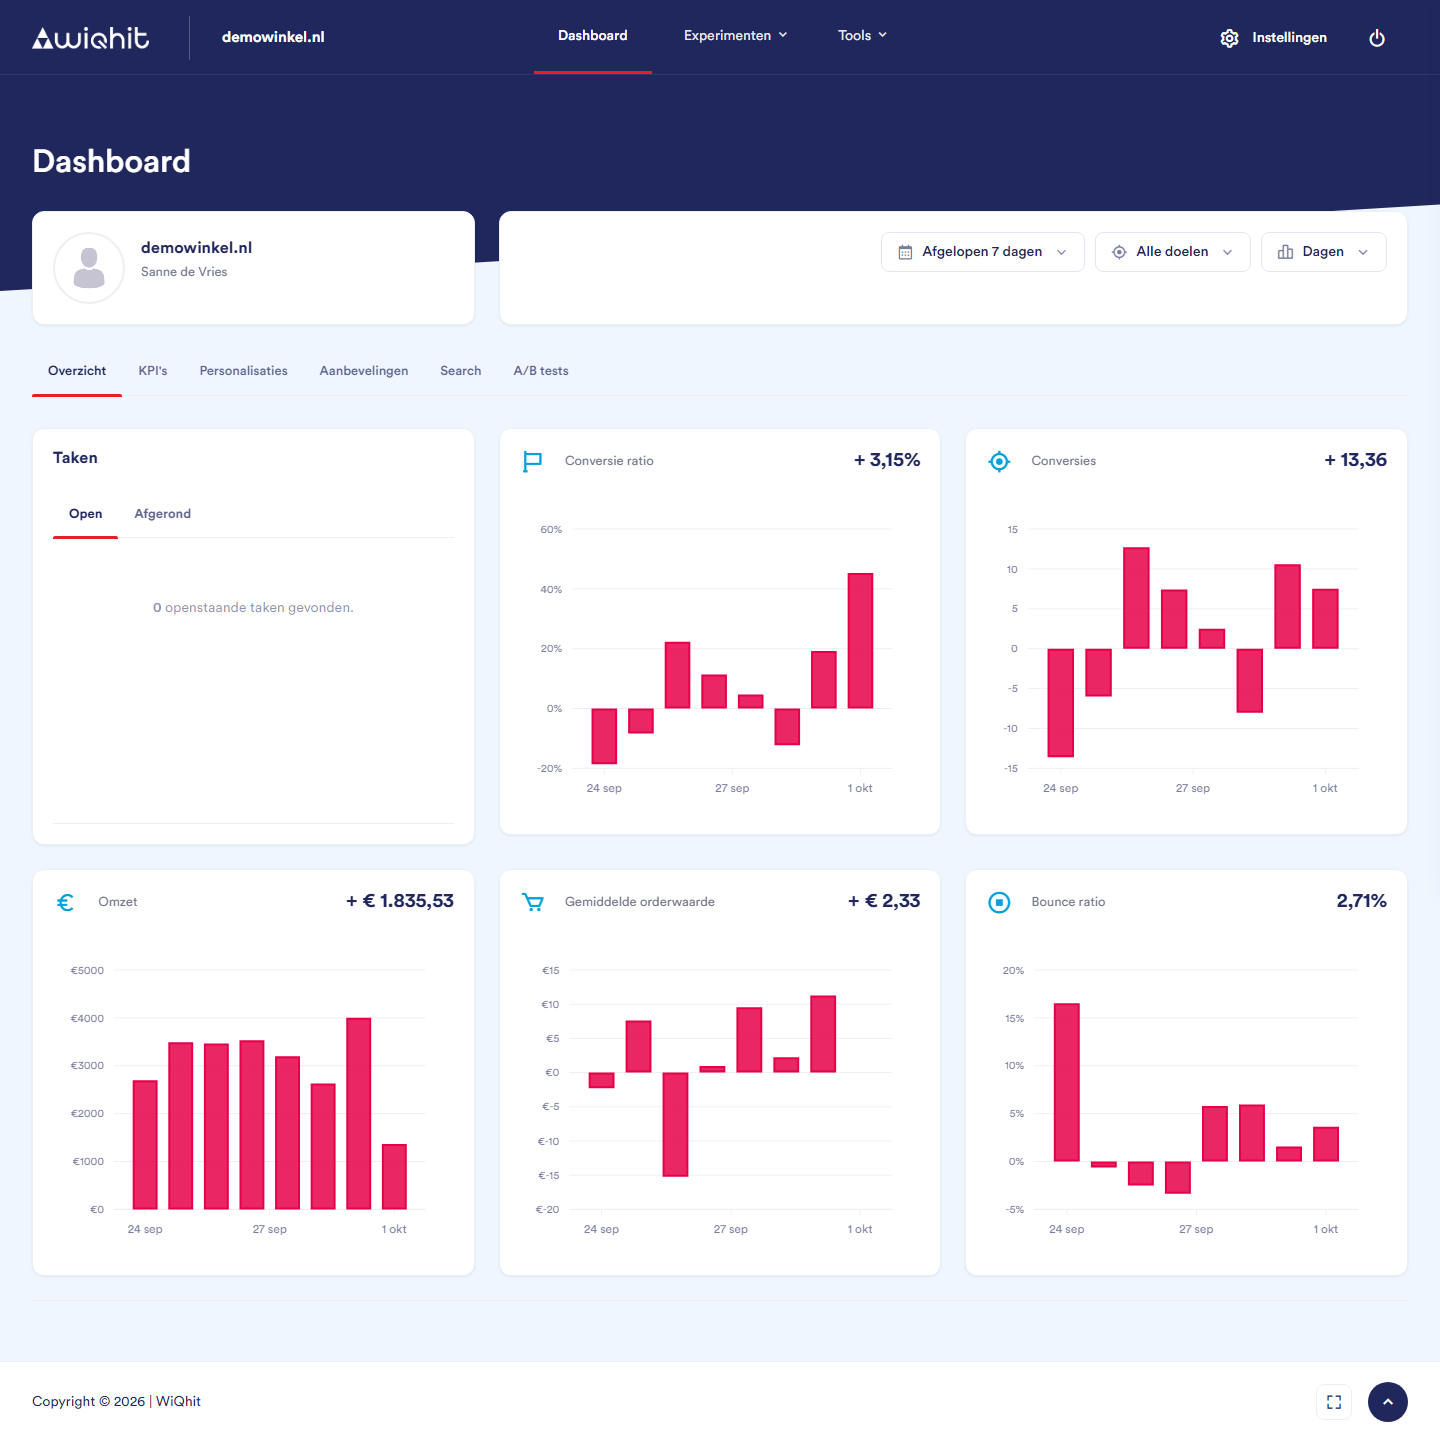
Step 1: Getting to know the app
Main menu: Dashboard, Experiments (A/B tests and personalisations) and Tools (recommendations, Search, Reviews and the product finder).
Settings (top right): the sections Profile, Workspace (including websites, tracking and users), Data and audiences and Integrations.
Step 2: Connecting your website
Under Websites, add the domains on which WiQhit is active. The WiQhit script only works on a website in this list.
Place the tracking code on every page of your website, or add it through your tag manager. See Tracking.
Check on the Tracking code tab whether visits are coming in. A green notification means that data collection appears to be working correctly.
Step 3: Setting up goals
Step 4: Inviting your team
Tip: Set up two-factor authentication for your account under Personal details.
Step 5: Creating your first test or personalisation
Step 6: Following your results on the dashboard
Setting the filters
Period: Today, Yesterday, Last 7 days (the default), Last 30 days, Last 90 days, or your own start and end date via Custom period. As long as your browser tab stays open, WiQhit remembers your choice.
All goals: the dashboard adds up all your goals. You can see the figures for a single goal in a widget's Statistics.
Days, Weeks or Months: how the charts group the figures.
Note: The figures are updated every hour with the previous full hour. What is happening right now will therefore only show up after one to two hours.
Personalised and control group
Important: The control group is usually much smaller. So compare ratios, such as the conversion rate, rather than totals. More visits and revenue in the personalised group are mainly because that group is larger.
Overview
Conversion rate: how many percent higher (or lower) the conversion rate of the personalised group is than that of the control group.
Conversions: how many more or fewer conversions you had than if the personalised group had converted just as well as the control group.
Revenue: the revenue of the personalised group minus what that group would have been expected to generate based on the control group's figures.
Average order value: the difference in euros between the two groups.
Bounce rate: how many percent higher or lower the bounce rate is. Here, a lower number is better.
Note: If your environment's control group is set to 0%, this tab shows the regular figures for all your visitors.
KPIs
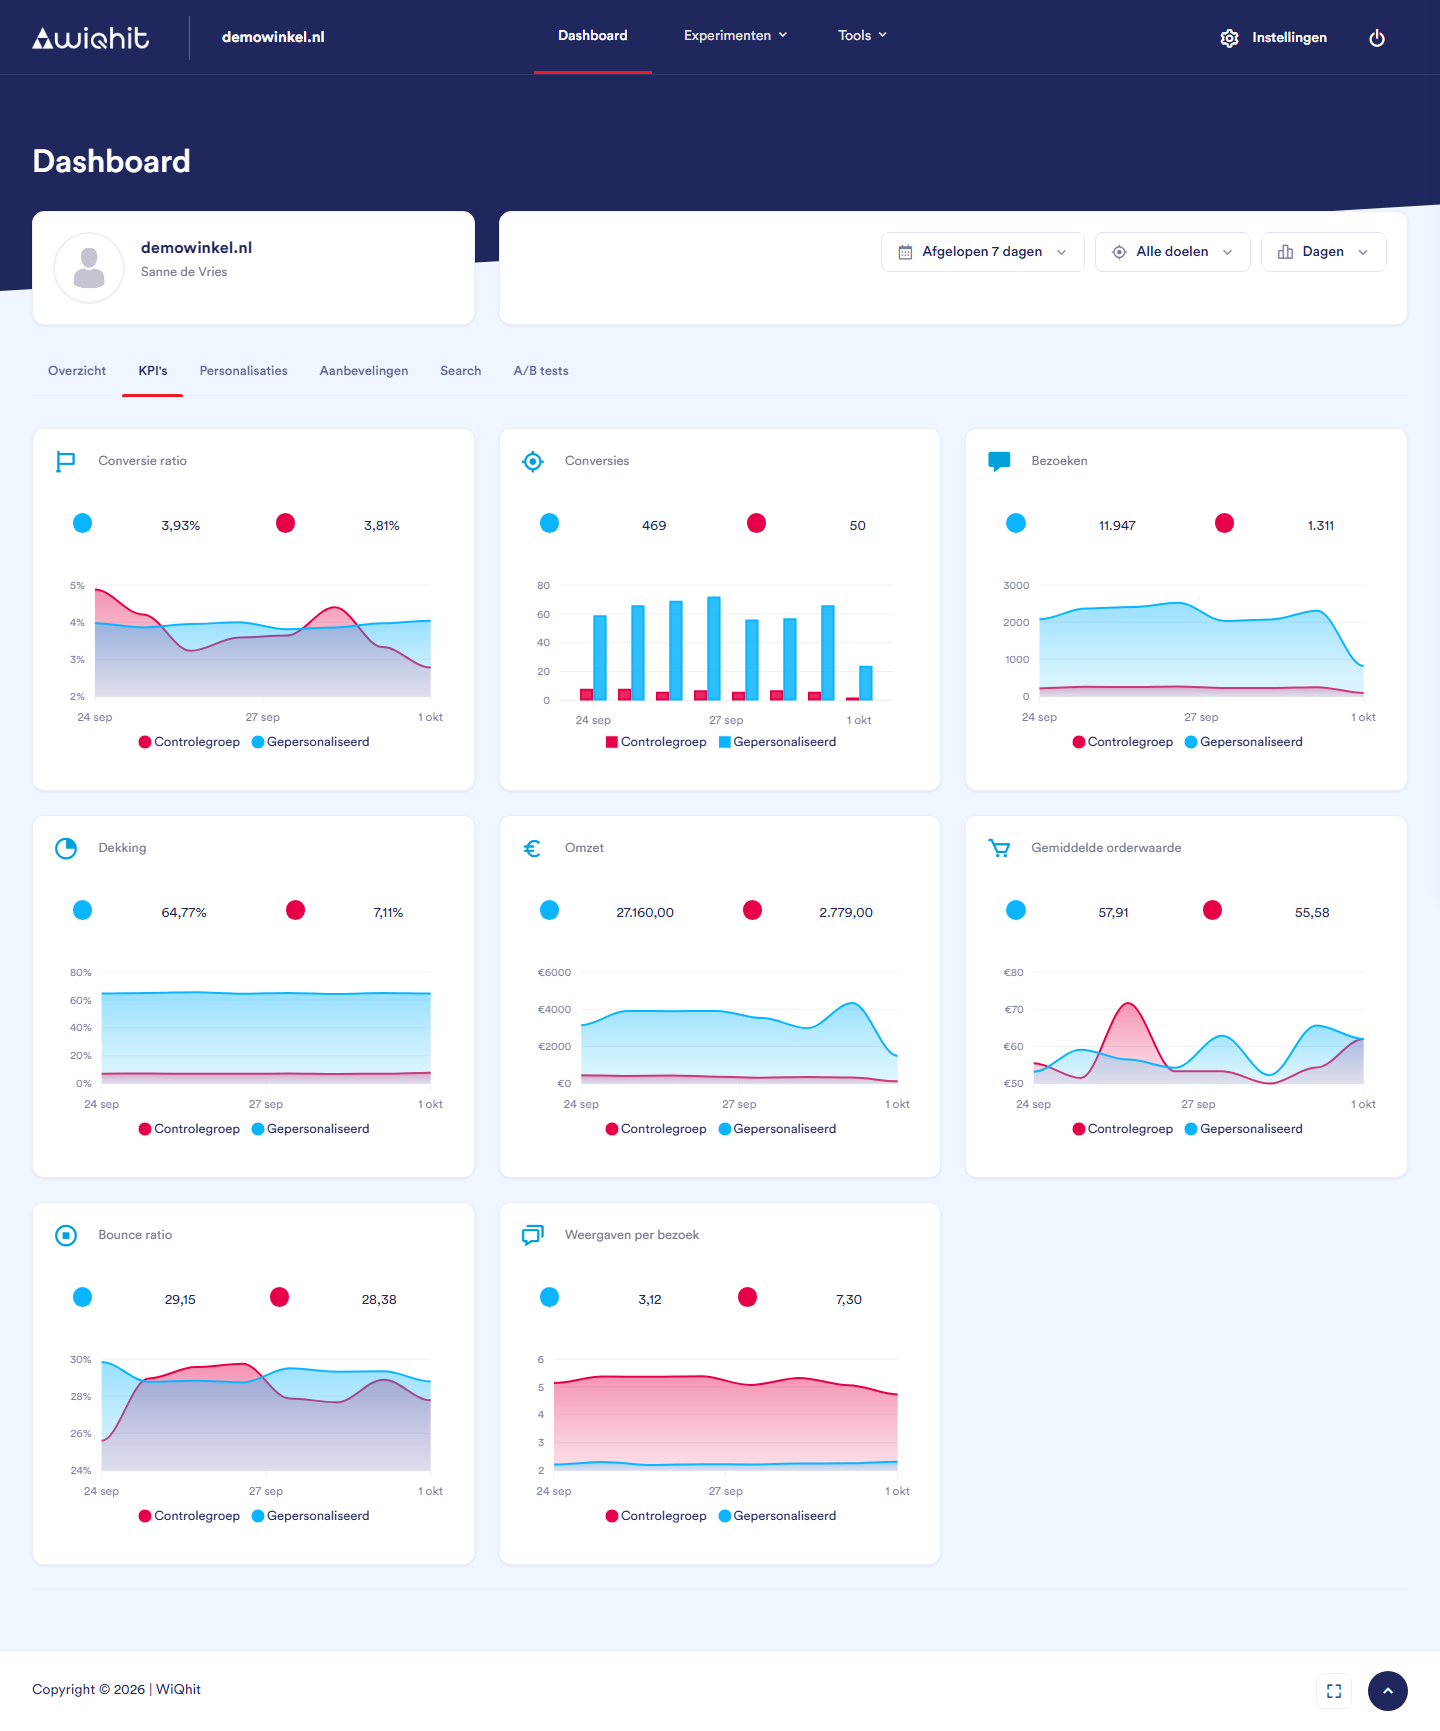
Conversion rate: the number of conversions divided by the number of visits.
Conversions, Visits and Revenue: the totals per group.
Coverage: the share of visits that encountered a personalisation.
Average order value: the revenue divided by the number of conversions. WiQhit counts all goals for this, not just orders.
Bounce rate: the share of visits that leave again after one page.
Views per visit: how often a widget was triggered per visit.
Note: If you have goals other than an order, the Average order value will be lower than your actual order value. You can find the actual value in your webshop.
Personalisations, Recommendations, Search and A/B tests
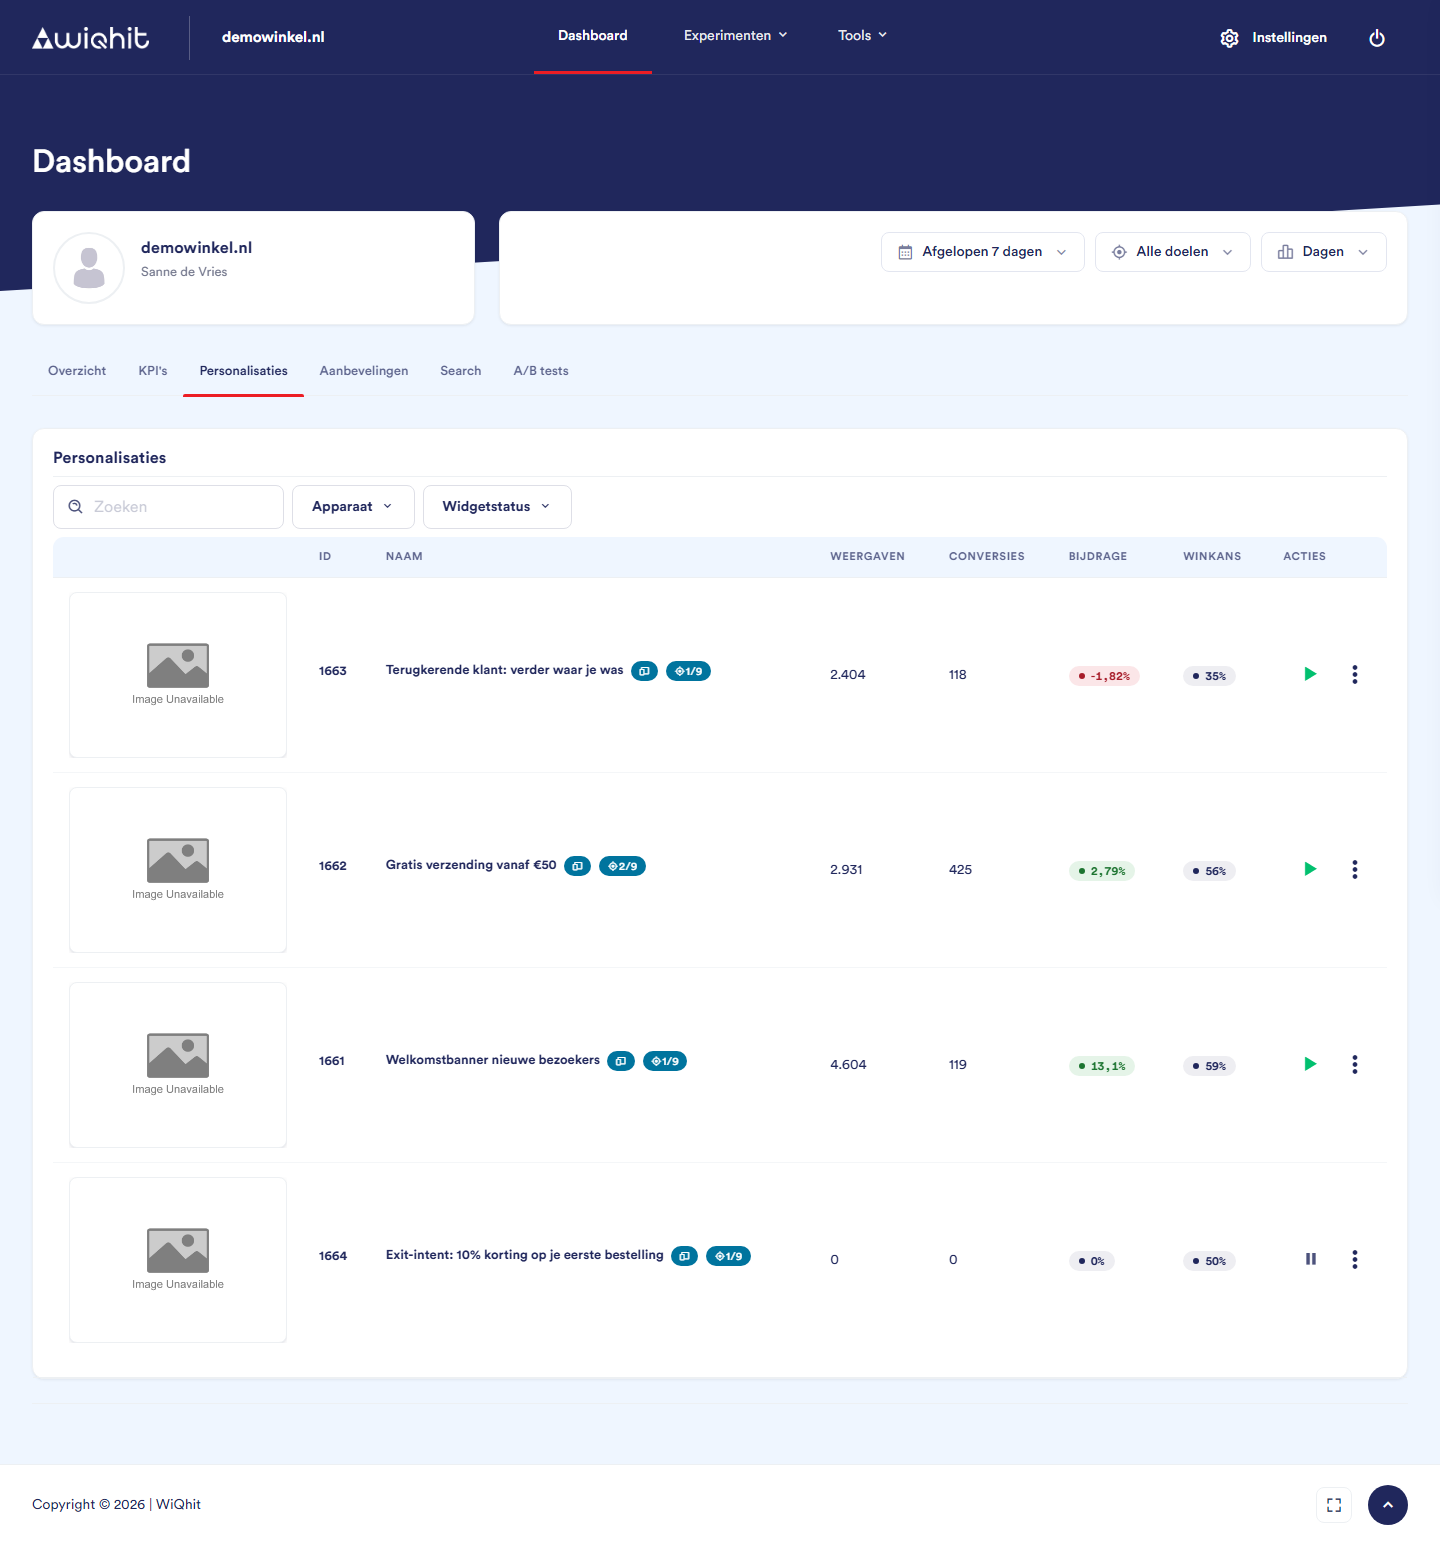
Views and Conversions: the numbers for the widget and its control group combined.
Contribution: how many percent higher or lower the conversion rate is than that of the control group.
Win probability: how likely it is that the widget really performs better. From 95% it turns green.
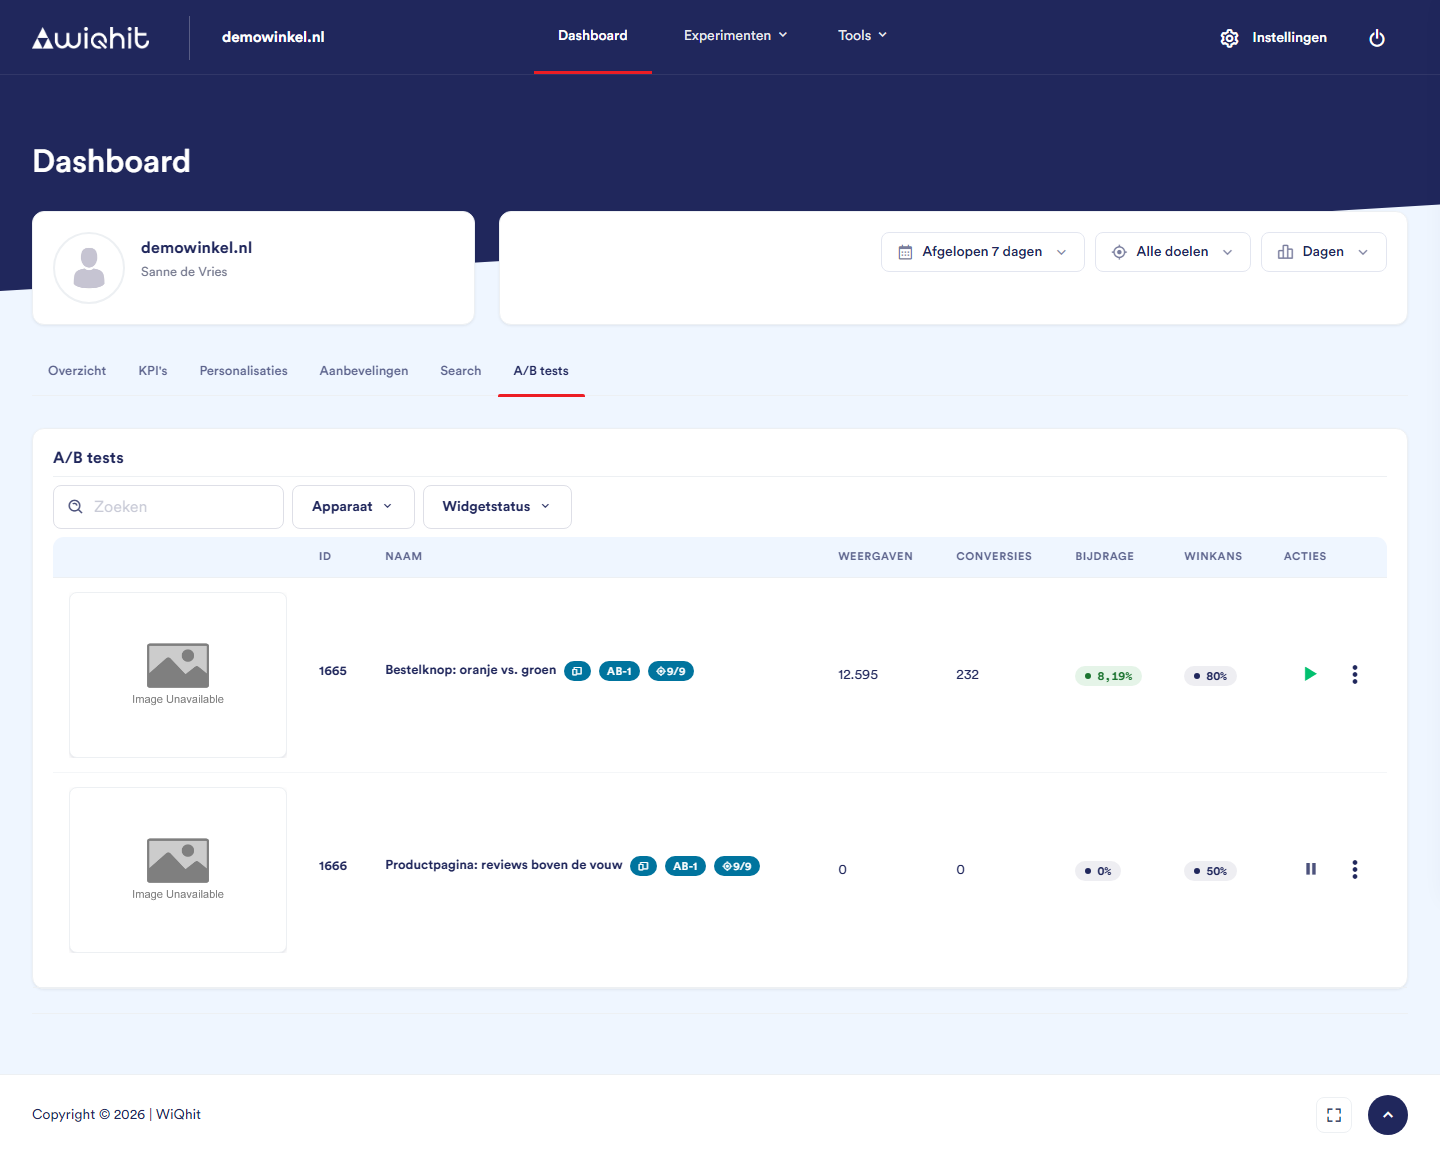
Important: The win probability in these lists is calculated differently from the one in the Statistics window, so they may differ. Use the list to see what stands out. To draw a conclusion, open ⋮ > Statistics.