Email dashboard
The email statistics report gives you a complete picture of all emails sent from Ternair Campaign. Test runs are excluded in this, so you only see the real results.
Filters
You can refine the statistics with different filters:
Campaign and Selection
Block description (the name of the green email block)
Period
Segment (useful when you have sent the same email to multiple audiences and want to compare the results for each audience)
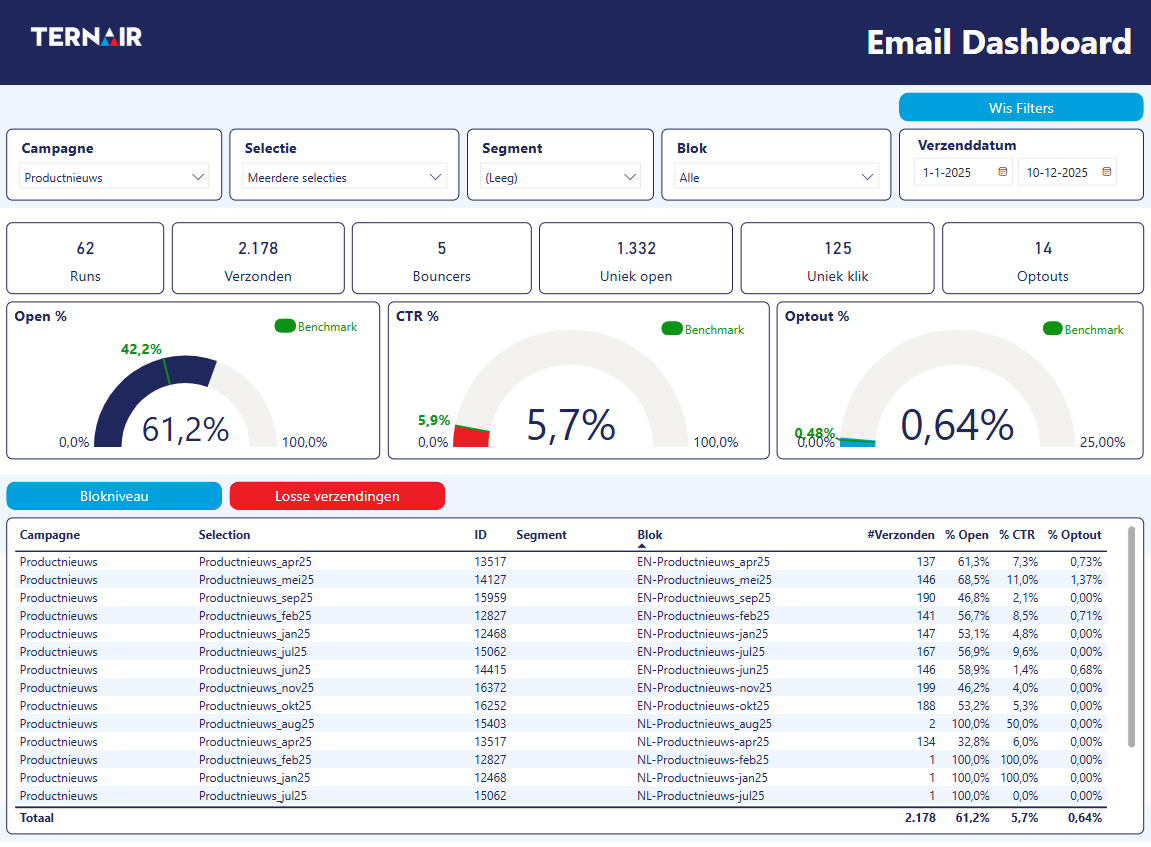
Report
Directly below the filters, you'll find a summary of the most important email KPIs. In addition, you can see the averages for opens, click-to-open (CTO) and click-through-rate (CTR). A green indicator shows the overall average, so you can easily mirror your numbers against the benchmark.
The default view shows results at the block level. Repeat sends of the same email block are aggregated here, but with the click of a button you can also view individual sends. Furthermore, the report contains clear charts where you can identify trends such as sent versus opened, CTR, best sending day and best sending duration. The last table also shows which subject lines were the most successful.